


Technical Analysis of Chinese Stock Market (SSEC
Shanghai Stock Exchange Composite) index
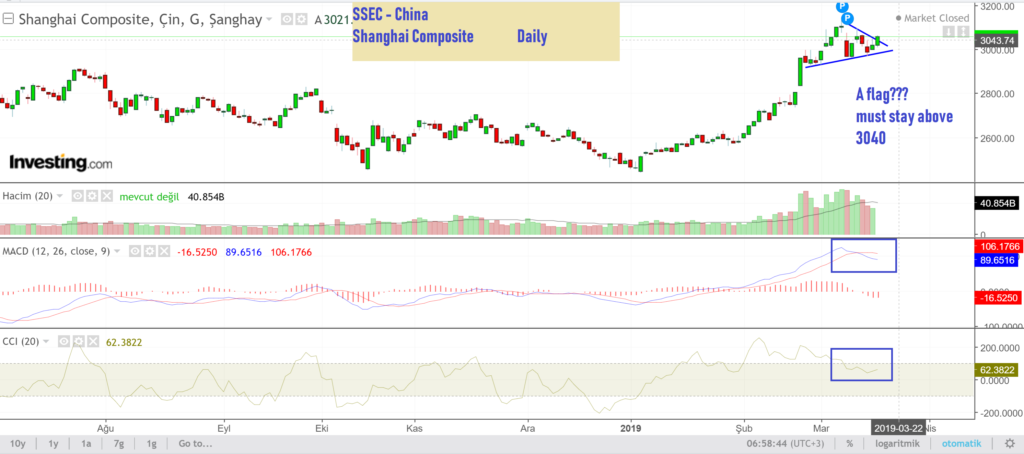
The flag formation’s target might be somewhere above 3500. MACD indicator is positive again. In addition, the prices are above the black upward trendline again. See additional comments below.
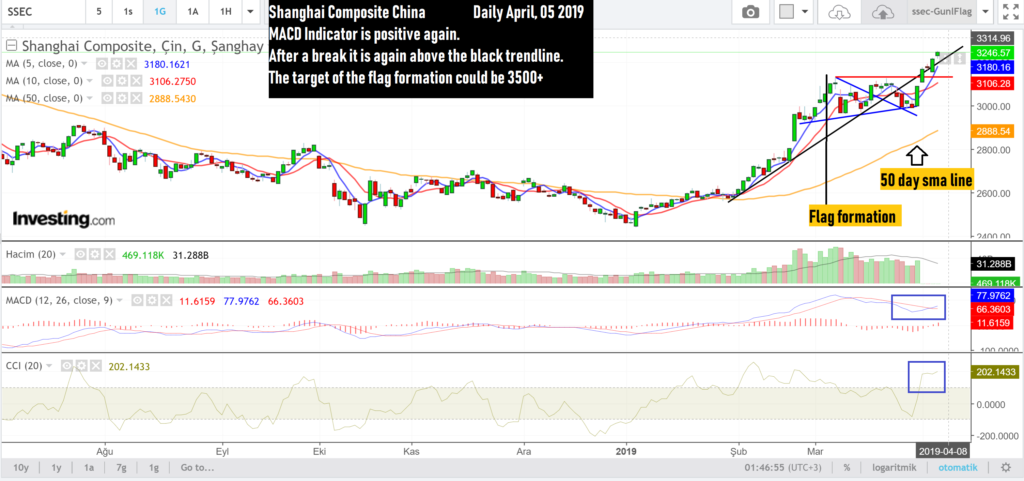
(April 5, 2019) SSE Composite Index ended the day at 3246 yesterday. Today is the last day of the week and is important in terms of the weekly closing price. Most probably it will stay above the 200-week standard moving average (sma). Our last technical analysis has not changed much. As it is seen SSE Shanghai Composite is almost at 3270 which labels the horizontal line at the chart. This level looks like a strong resistant point.
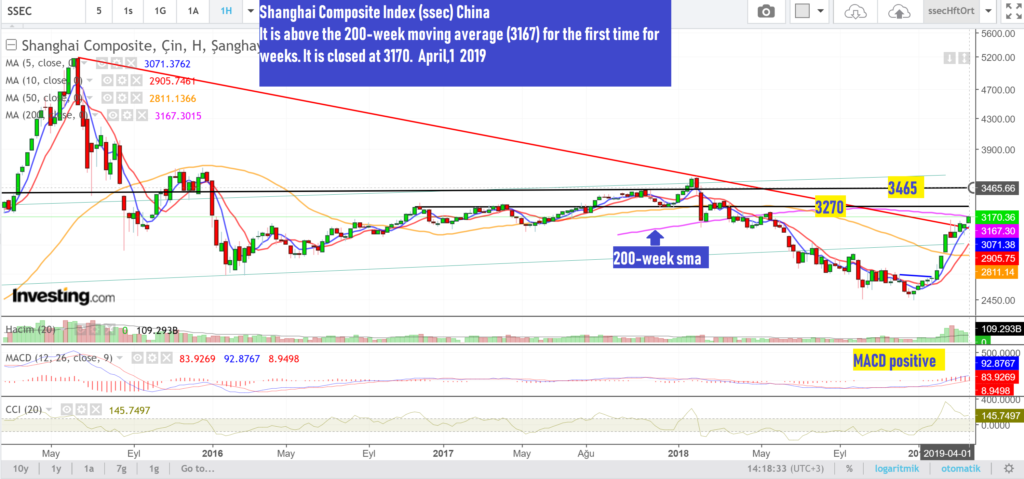
(01 April 2019) Technical Analysis of Shanghai Composite Index (ssec) China: It is above the 200-week moving average (3167) for the first time for weeks. It is closed at 3170. MACD is positive which is good for mid and long term investments. CCI is changing the direction.
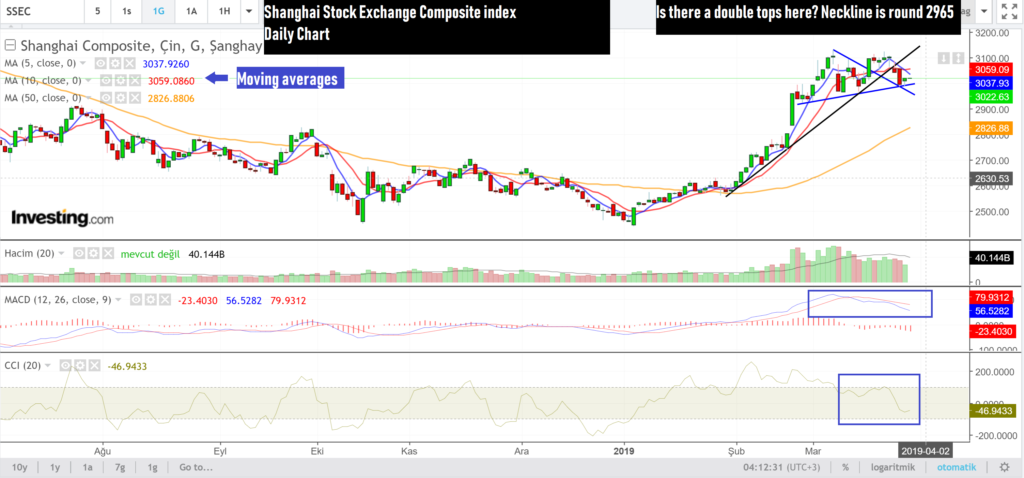
(28 March 2019) Is there a double top here? Neckline is around 2965. Upward trendline was broken. We were expecting it to stay here for some time. It is positive that the prices are above 50-day sma. But see the MACD indicator.
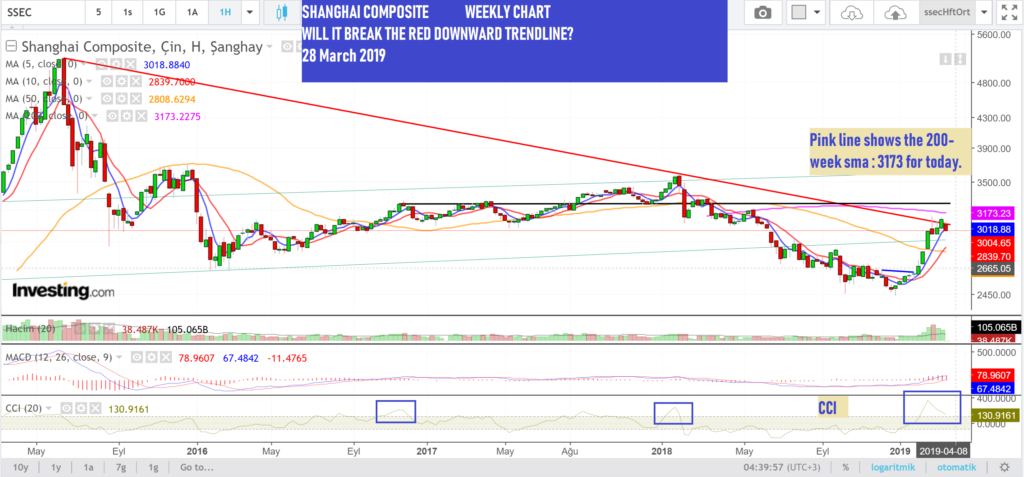
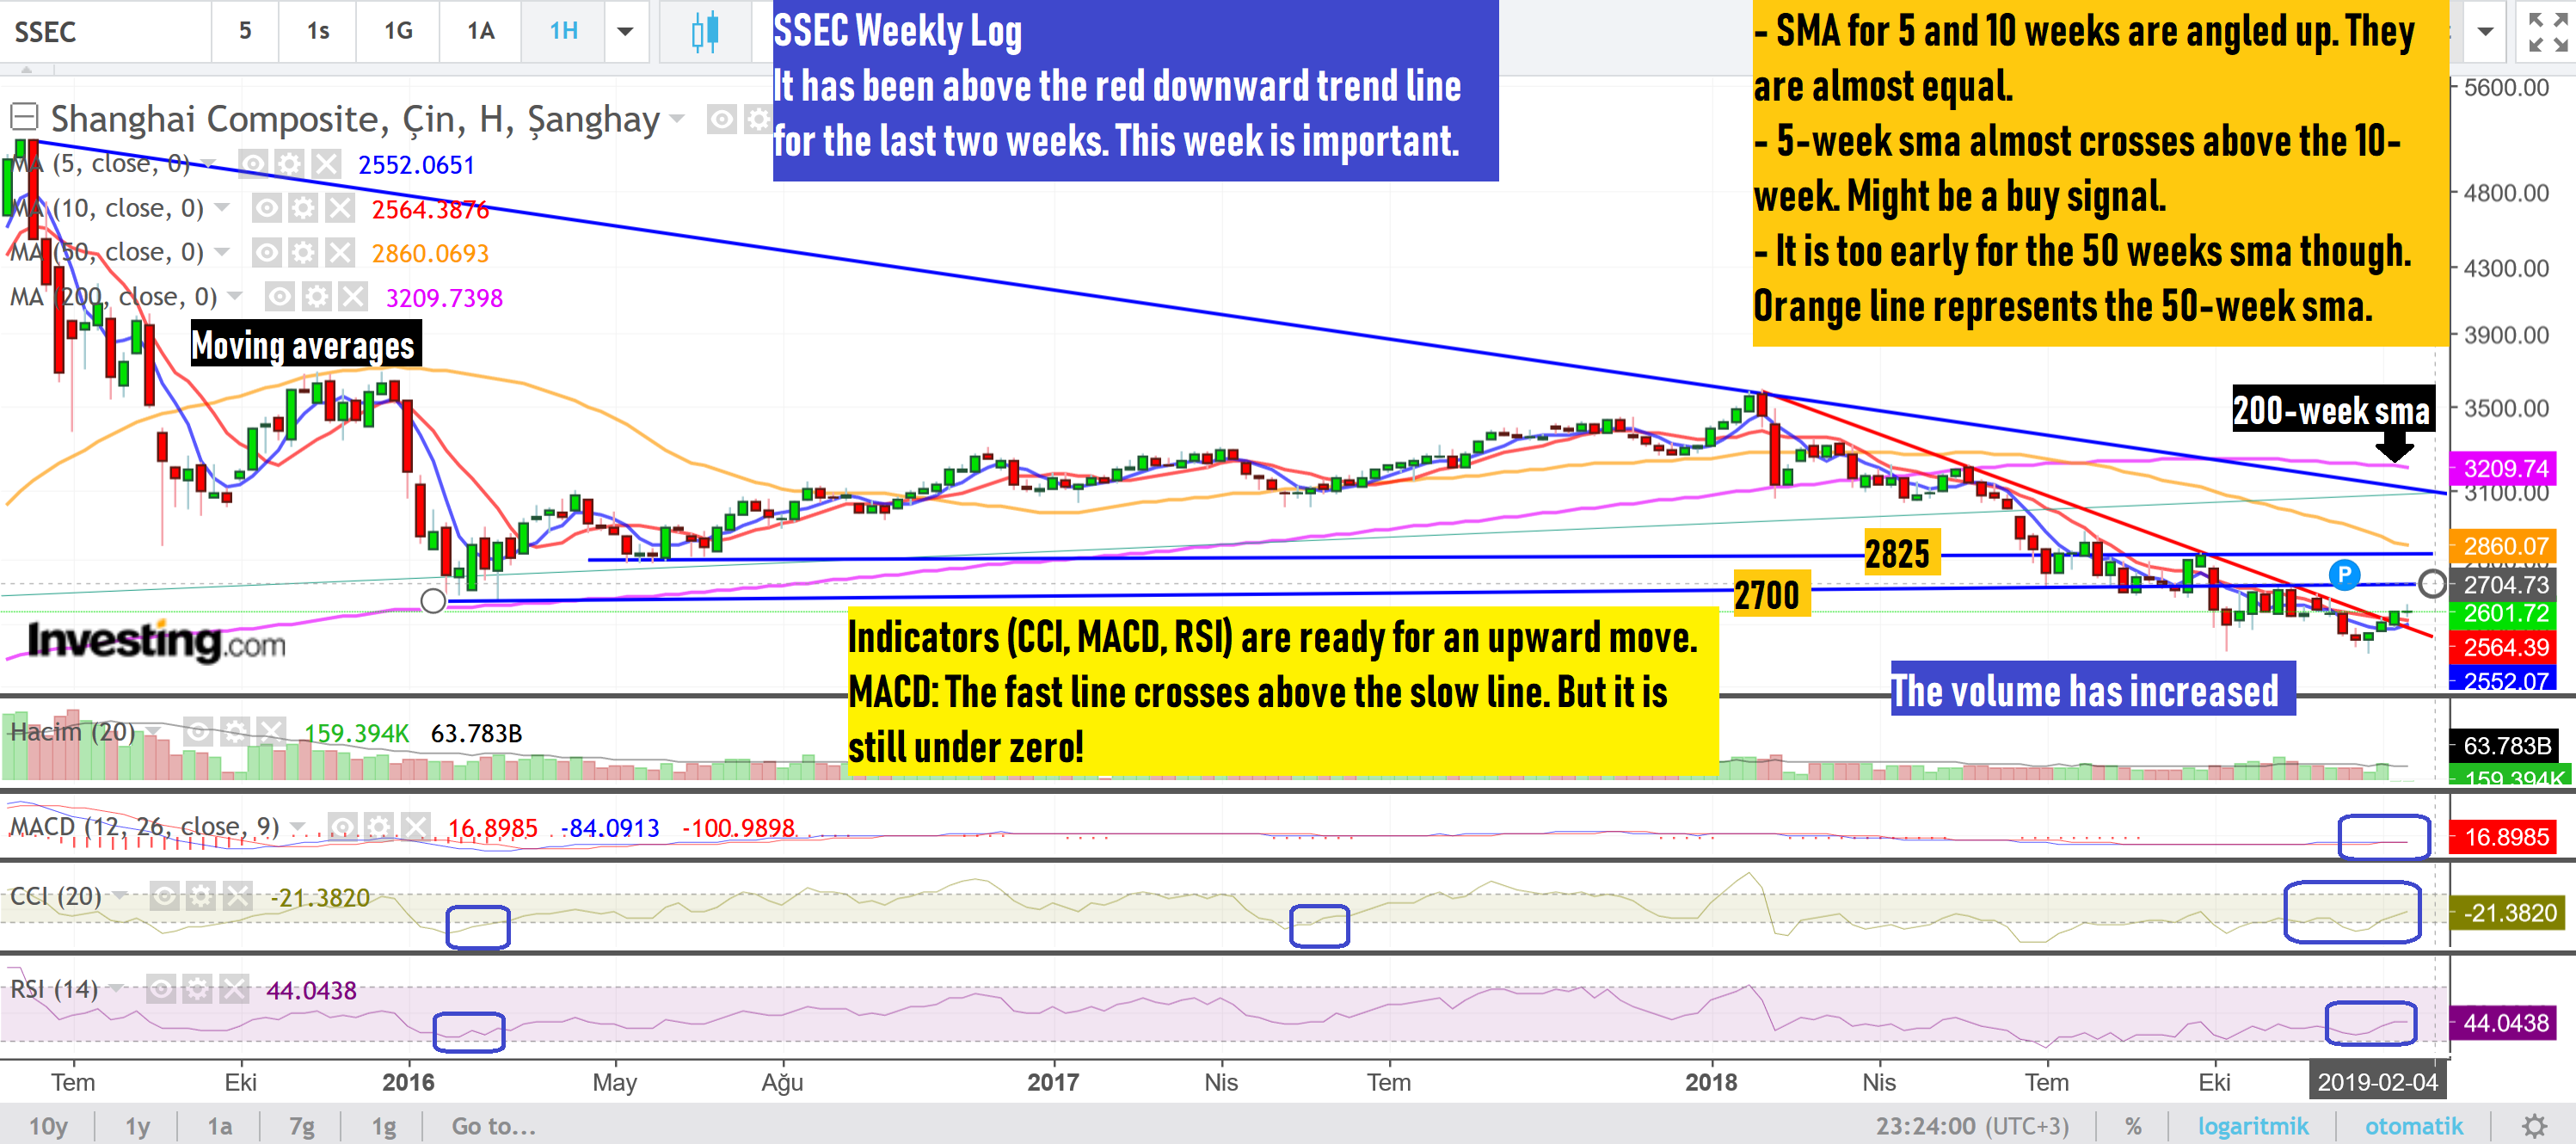
In the weekly chart the pink line shows the 200-week sma which is 3173 for today. The red downward line serves as a resistant level. We should watch CCI closely.
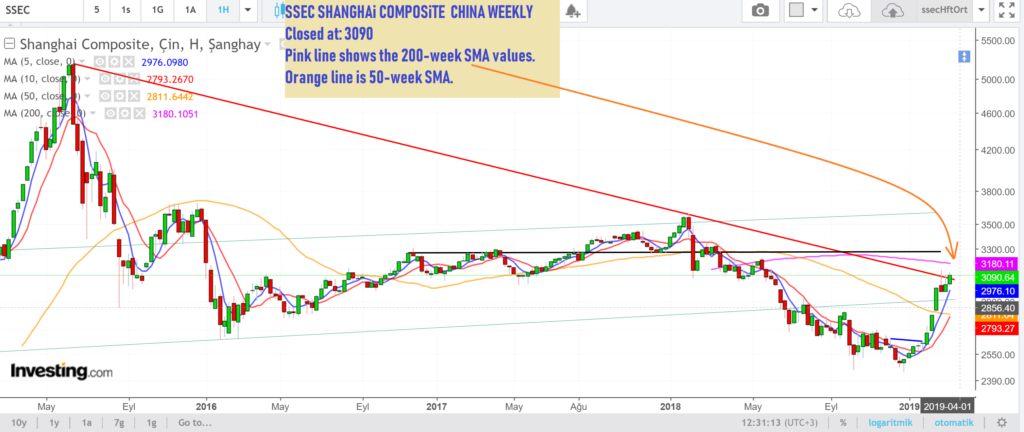
SSEC SHANGHAi COMPOSITE CHINA is closed at: 3090
Pink line shows the 200-week SMA values.
Orange line is 50-week SMA. It is above the red downward trendline but below the 200-week sma!
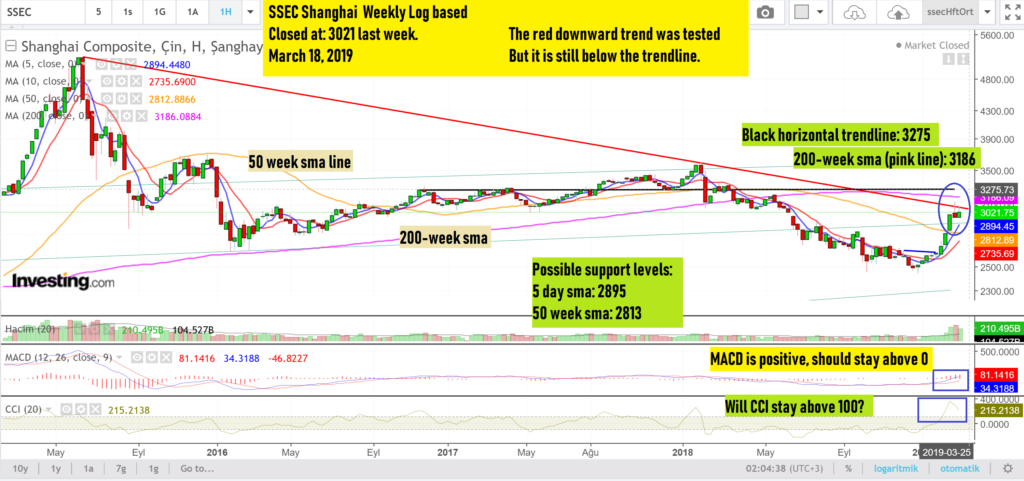
- (March 18, 2019) SSEC Shanghai Weekly Chart – Log based (Closed at: 3021 last week.)
- The red downward trendline was tested but it is still below the line.
- Black horizontal trendline: 3275
- MACD is positive but should stay above 0. Will CCI stay above 100?
- Possible support levels: 5 day sma: 2895, 50 week sma: 2813 (sma: standard moving average)
- 2970 look like a support level. 3070 is the weekly resistant point.
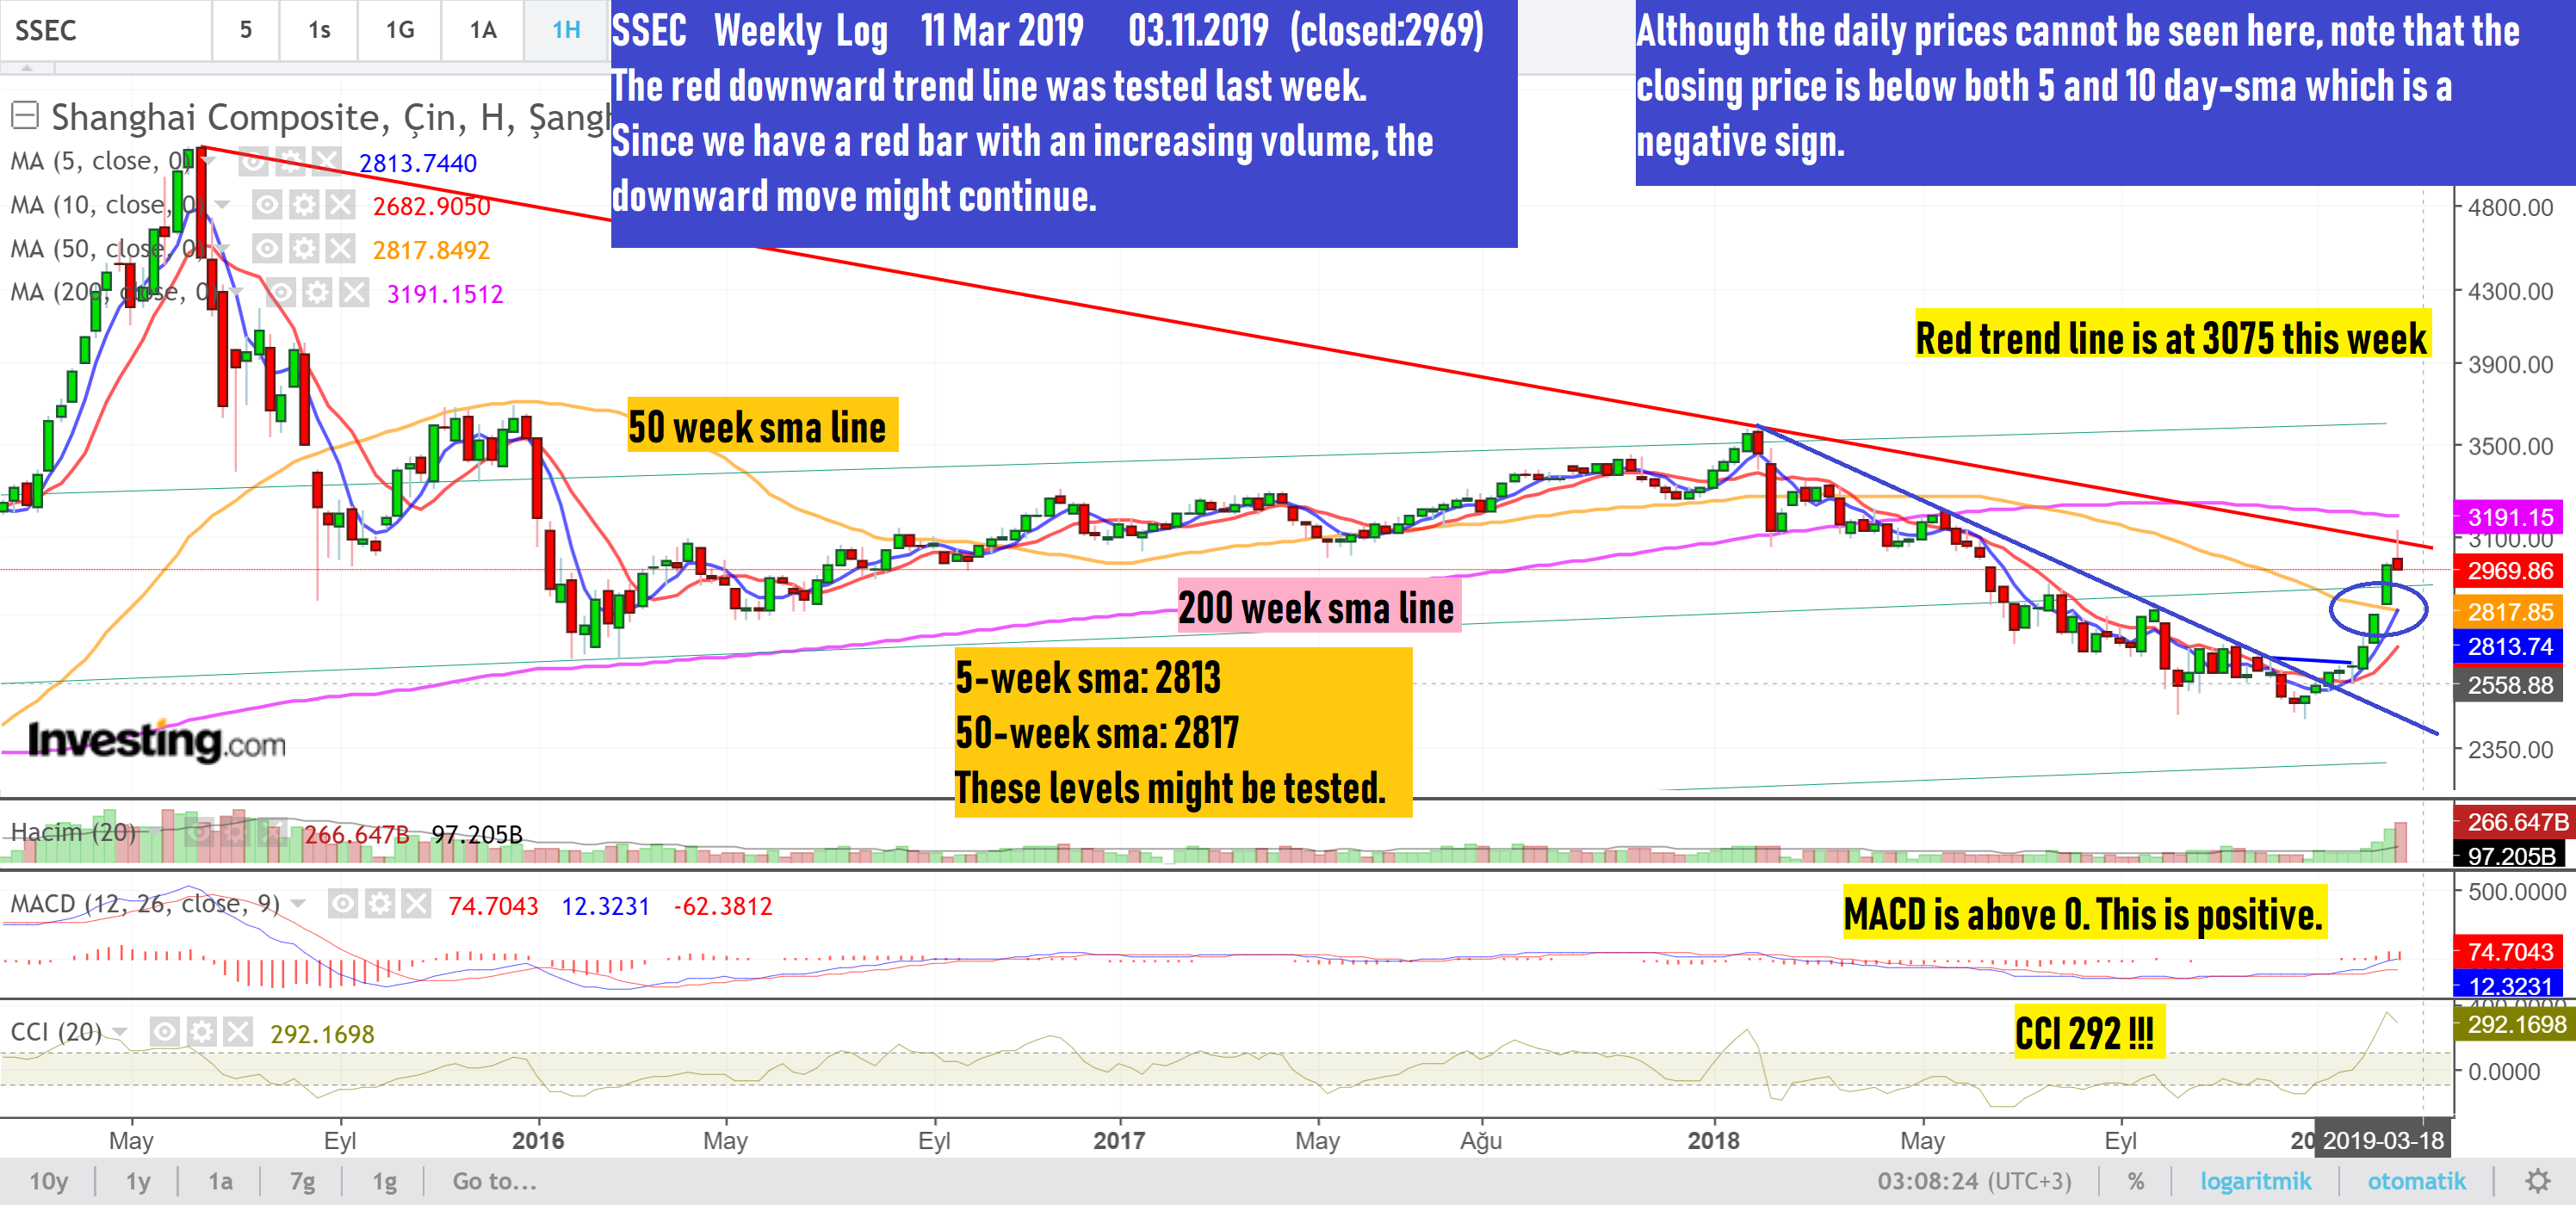
- The red downward trend line was tested last week. It was a good exit point for the short-term.
- Since we have a red bar with an increasing volume at that point, the downward move might continue.
- Although the daily prices cannot be seen here, note that the closing price (2969) is below both 5 and 10 day-sma which is a negative sign.
- 5-week sma ( simple moving average ) : 2813, 50-week sma: 2817. These levels are very close and might be tested. As long as the prices are above 50 week sma, we can wait.
- If the upward trend continues the red trend line is at 3075 this week.
- MACD is above 0. This is positive. But CCI is too high.
My Previous Weekly Technical Analysis is Shown Below:


 Kazandıran Teknik Analizlerimiz