


Technical Analysis of MSCI Emerging Markets
(03/26/2019) If MSCI EEM can stay above the 50-week sma, upward movement can continue. It is right below it now. Also see the double bottom which may take us to at least 45.
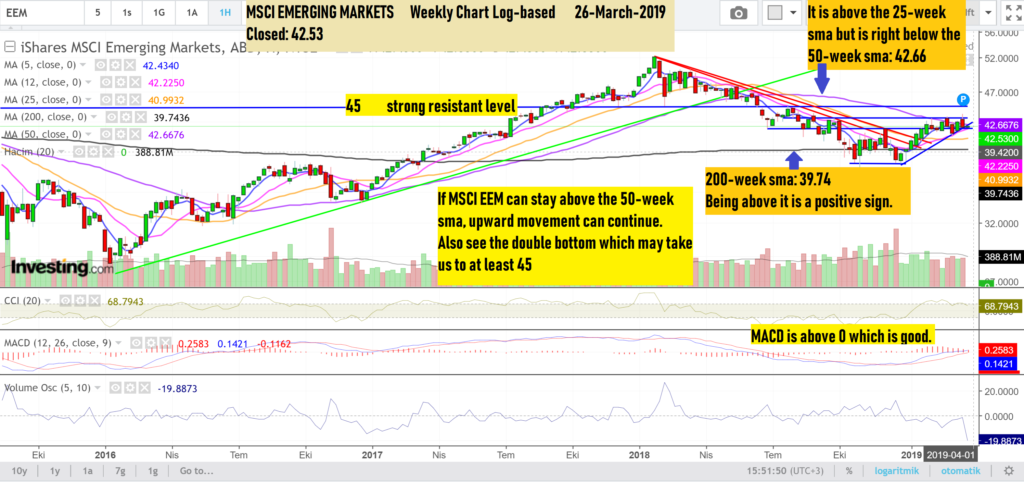
Indicators: MACD is above 0. As long it stays there and crosses the trigger line, we can expect an upward movement.
It is under the short-term blue trendline though. If it passes 50-week sma, It will also be on this trendline. Other positive signs are it is above 25 and 200-week sma values which is good for long term.


 Kazandıran Teknik Analizlerimiz